


Cigarette Pricing + Demand
When will cigarette demand collapse?

Since the 1950s, the proportion of Americans who smoke cigarettes, the absolute number of American smokers, and the number of cigarettes smoked each year have all dropped significantly.
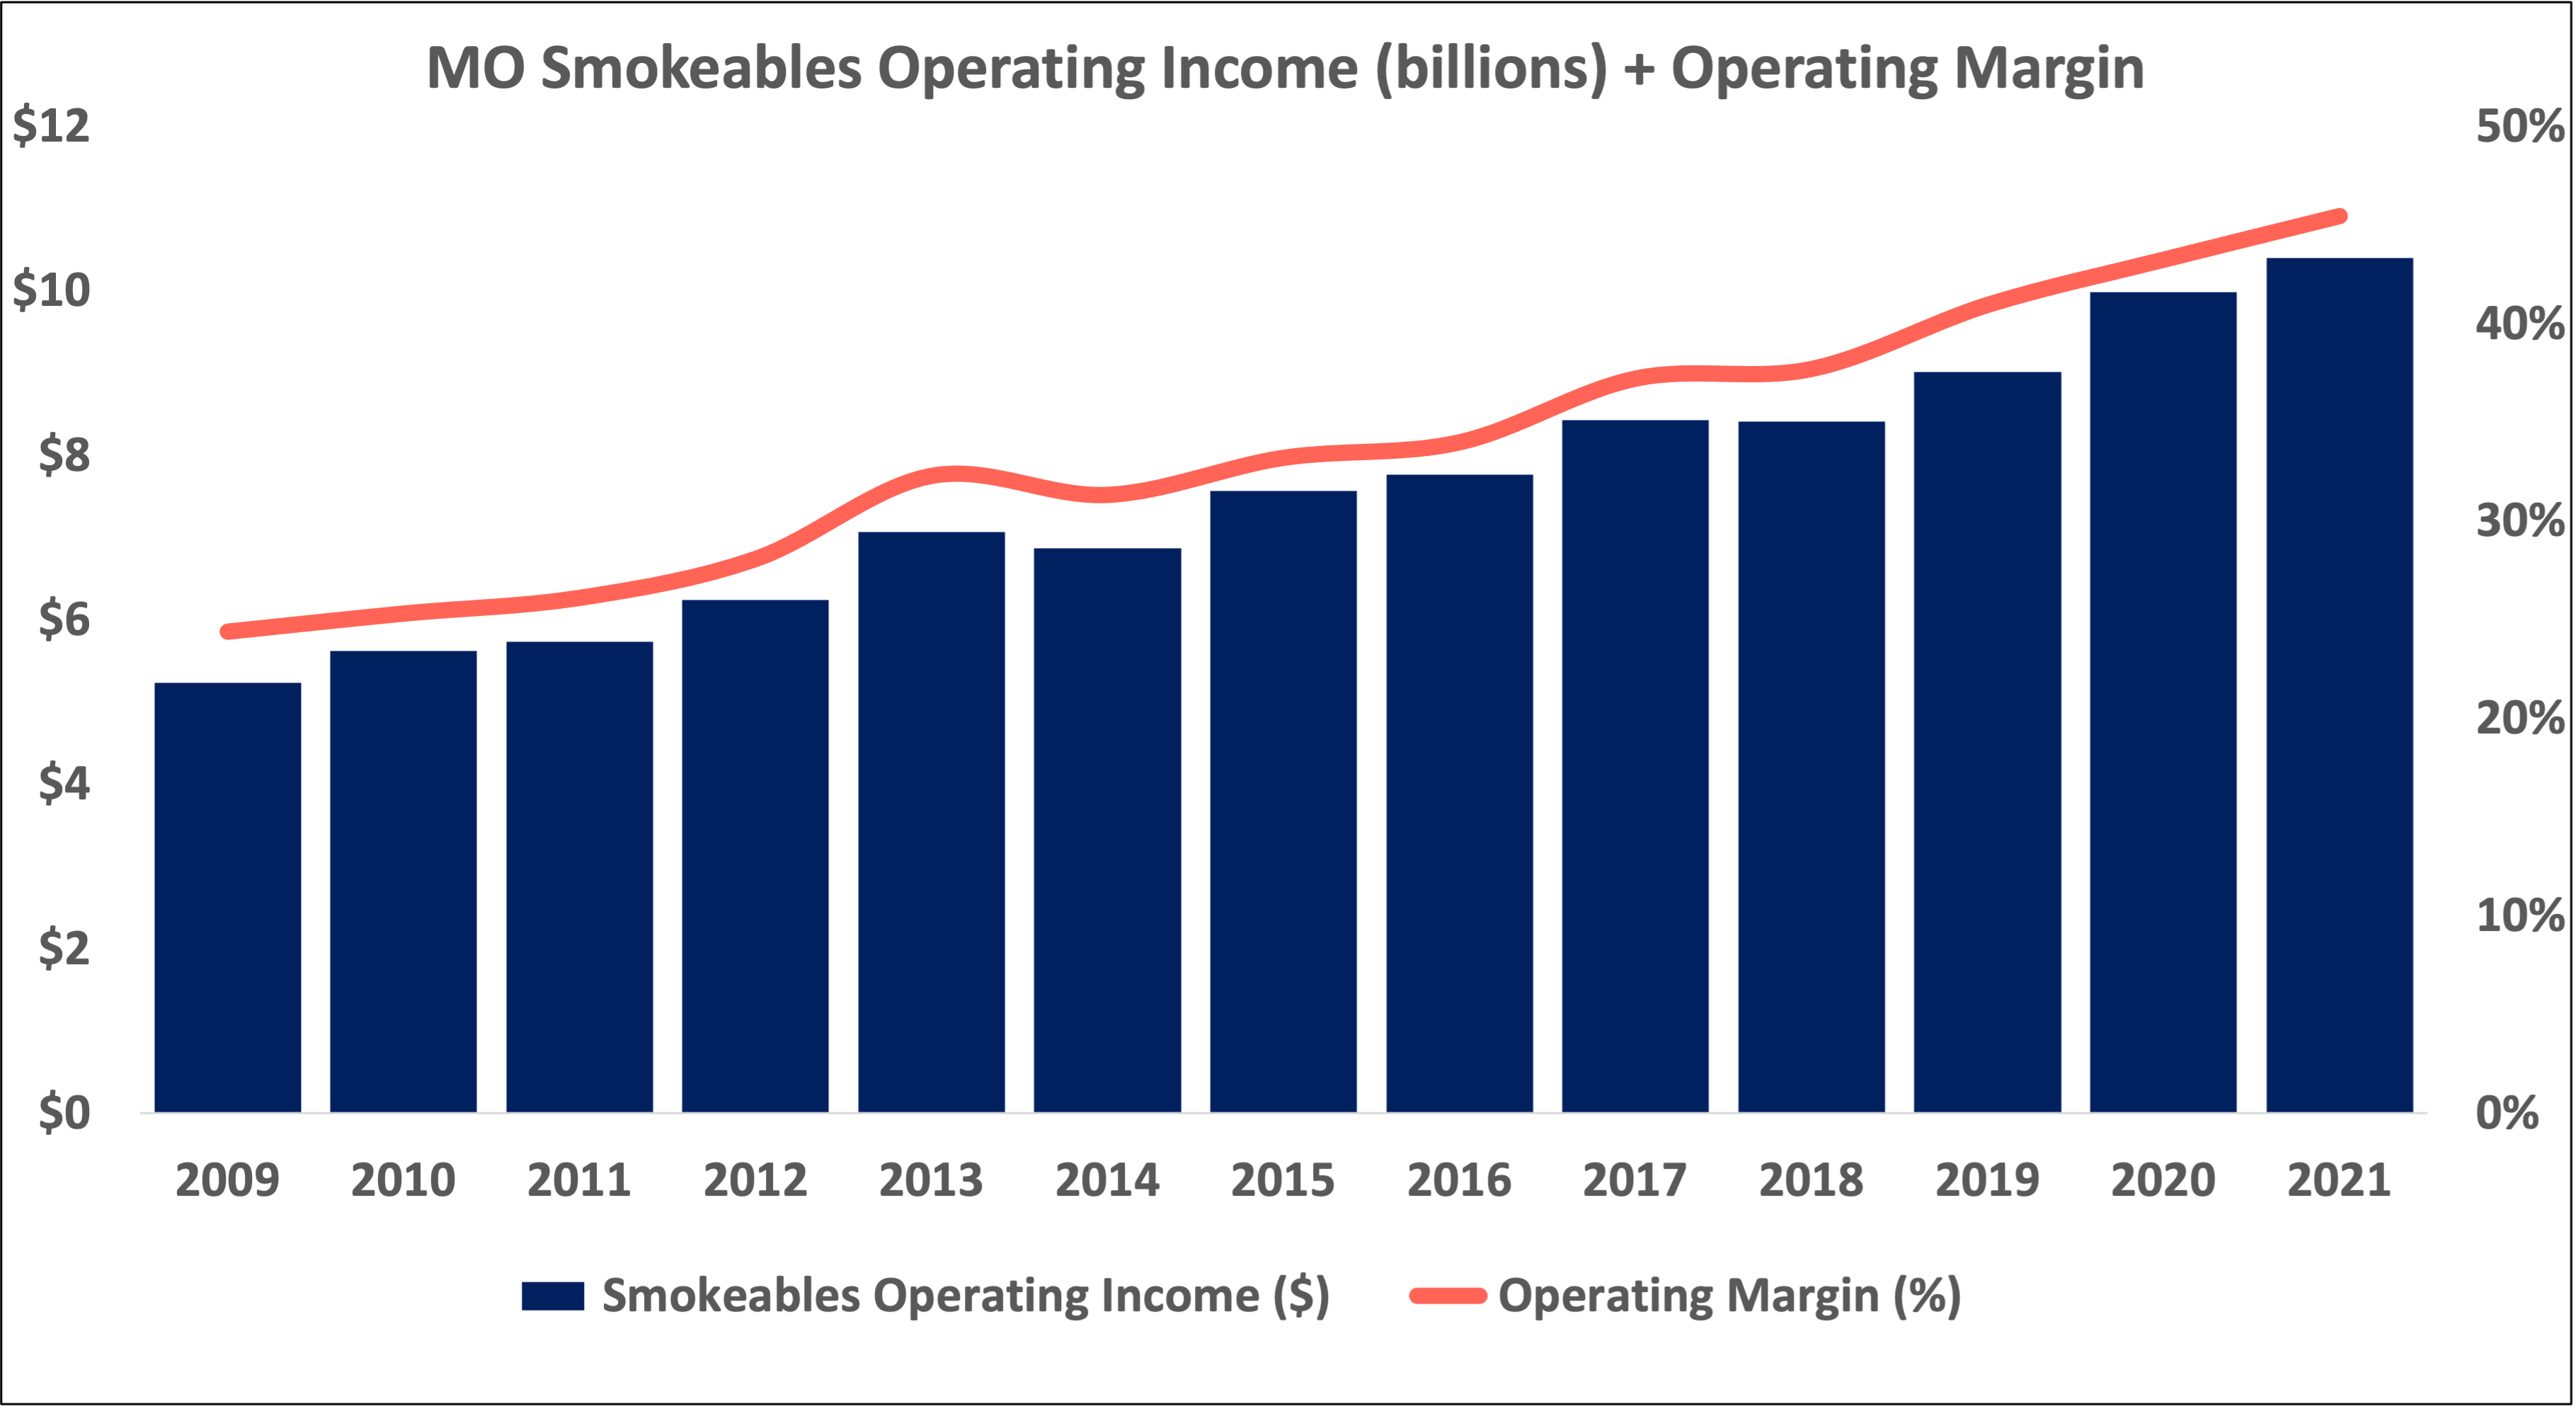
Despite smoking’s decline over the decades, about 30 million Americans still smoke. Altria’s smokeables volumes have dropped over 33% between 2009 and 2021. Yet its revenues from smokeables are up almost 7% over the same time-frame.
How has Altria grown cigarette revenues despite selling fewer cigarettes?
The answer is pricing.
Smokers are addicts — most will prioritize the habit despite the costs. So management has routinely increased cigarette prices to make up for selling fewer of them over the years.


But doesn’t increasing prices accelerate volume declines? Won’t fewer and fewer people buy Marlboros if Altria keeps jacking up prices? The answer is yes — but to a limited extent.
Data shows that demand for cigarettes remains strong despite price increases. For example, a 5% increase in the price of cigarettes may lead to only a 1% decrease in volumes. In other words, price increases result in relatively low decreases in consumption.
Thus, over the decades, despite millions of smokers smoking fewer sticks or quitting altogether, the demand from those who keep the habit has led to not just more revenue for Altria but more revenue at higher margins. Operating margins and operating profits from Altria’s smokeables segment have increased almost every year from 2009 to 2021.

At what point, though, will a 5% increase in the price of cigarettes lead to more than a 5% decrease in volumes? For example, a smoker might be fine with a $5 pack of cigarettes each day but not with a $10 one. What price point would cause smokers to quit in numbers that would spell trouble for Altria’s pricing strategy?
The National Bureau of Economic Research (NBER) predicted that once the price per pack of cigarettes surpassed $6, the decline in demand would start to outpace the industry’s ability to maintain or increase revenue via price increases.
But NBER’s $6 threshold doesn’t appear to hold true today. It turns out that there are other factors that render NBER’s blanket threshold untrue:
Excise taxes: What proportion of price increases are eaten up by excise tax increases? If excise tax increases outpace price hikes, Altria will take in less profit per pack.
Inflation: What proportion of price increases are eaten up by inflation? On one hand, inflation, which makes everyday goods less affordable if income doesn’t rise at the same rate, can stress out smokers, leading to more demand for stress-relieving cigarettes. On the other hand, inflation acts as a sort of implicit price hike, the effect of which could be negative for Altria if it is unable to control costs and if the incomes of its customers don’t grow with inflation.
Affordability: How are the incomes of smokers growing relative to price increases? Income growth can offset the negative effect that price and excise tax increases have on cigarette demand. Higher incomes relative to cigarette prices make smoking more affordable.
Generally, higher cigarette prices correlate with lower rates of smoking. As a product gets more expensive, consumer demand tends to decrease. While the addictive nature of cigarettes dampens the effect of high prices on demand, prevalence is certainly inversely correlated with price.
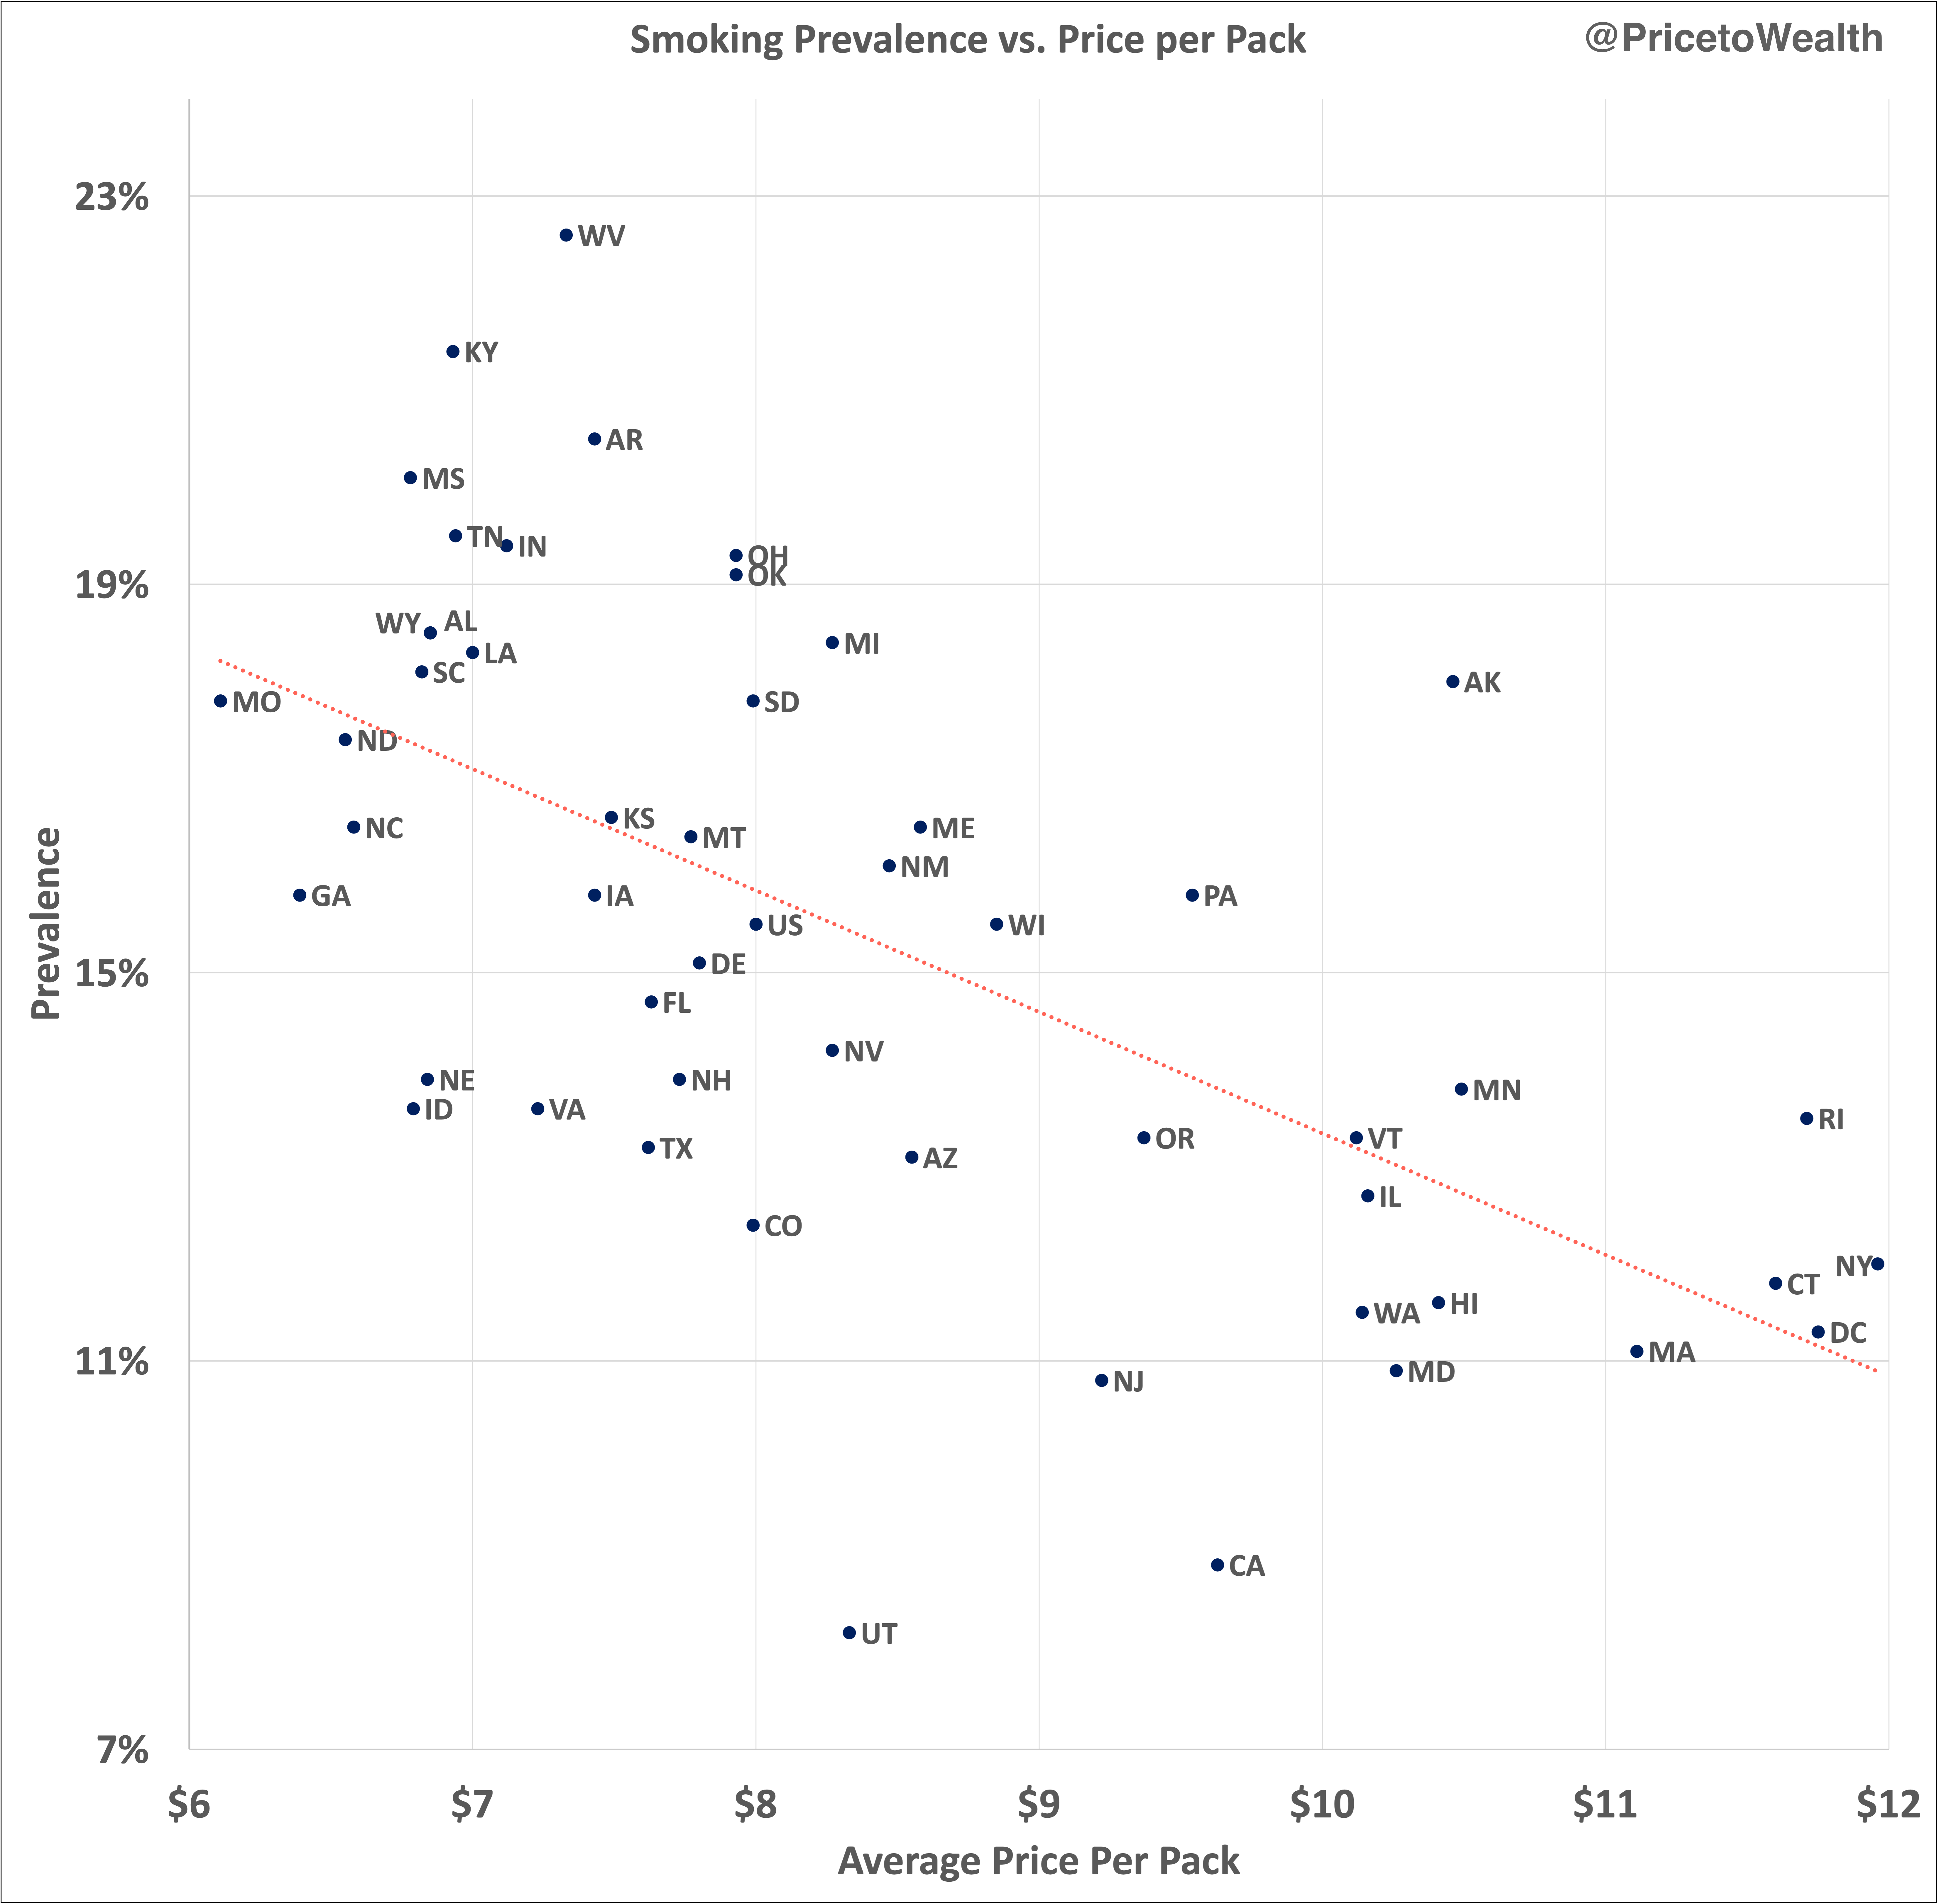
When looking at a dataset with two variables, we can measure the strength of the relationship between those variables by calculating the correlation coefficient. In this case, the correlation coefficient for smoking prevalence given the average price per pack of cigarettes is -0.61. This means that as the price of a pack increases from one state to the next, the rate of smoking (prevalence) decreases. The strength of this inverse relationship is moderately strong.
But concluding that price hikes on cigarettes have the same negative effect on demand in all markets ignores the unique characteristics of distinct populations. Price alone is not the only factor that influences smoking rates. Affordability, lifestyle, education, culture, and religion each probably have some effect on prevalence across markets.
For example, the inverse relationship between pricing and prevalence doesn’t appear to hold up when considering affordability (cost of smoking relative to income). In the graph below, cost relative to income is the annual cost of smoking five packs per week in a particular state as a percent of the median household income in that state.

Whereas the correlation between pricing and prevalence is negative (-0.61), the correlation between the relative cost of smoking and prevalence is actually positive. In other words, as the cost of smoking relative to income increases from one state to the next, prevalence actually increases. Granted, the correlation coefficient (0.14) is very weak, but the fact that it’s positive at all is remarkable. And counterintuitive. Why would a population with a higher relative cost of smoking have a higher rate of smoking than a state with a population that can more easily afford the habit?
For example, the price of cigarettes is higher in New York than in any other state. New York is also the least affordable state to be a smoker — the cost of smoking is highest relative to median income compared to all other states. But even with these absolute and relative differences, the rate of smoking in New York is still higher than it is in Utah and California, which rank 21st and 32nd, respectively, in cost per pack and 37th and 49th in cost relative to income. How can New York, which ranks first in cost per pack and cost relative to income, have a higher proportion of smokers than Utah and California, states where smoking is so much more affordable?
One answer is religion. Over 60% of Utah’s population is Mormon. The Church of the Latter Day Saints forbids its members from consuming tobacco, alcohol, coffee, marijuana, and other substances. So even though it is so much more affordable, in absolute and relative terms, to be a smoker in Utah than in New York, the religious makeup of Utah’s population has led to a sub-9% smoking rate there compared to New York’s rate of over 14%.
An explanation for California is less obvious. California’s price per pack is under $10 and the annual cost of smoking accounts for less than 3.5% of the median household income. In contrast, cigarettes in New York cost on average almost $12 per pack and the cost of smoking accounts for over 4.5% of the median household income. Despite these differences, California’s smoking rate is over three percentage points below New York’s. Perhaps Californians prefer more health-conscious lifestyles than New Yorkers do. Maybe New York’s weather makes New Yorkers want to smoke more despite the cost. Maybe the high price of a pack in New York has bestowed upon cigarettes a halo of luxury — smokers in Soho might “signal” to others that they can afford the hefty price tag. Maybe it’s just a cultural difference.
West Virginia is another case that turns the traditional price and prevalence narrative on its head. Despite being the 5th least affordable state to be a smoker, West Virginia ranks first in prevalence. 22.60% of the state’s population smokes. The next four highest ranking states when it comes to prevalence are Kentucky (21.40%), Arkansas (20.50%), Mississippi (20.10%), and Tennessee (19.50%) — these four states have achieved lower rates of smoking compared to West Virginia despite lower smoking costs relative to income and, with the exception of Arkansas, less expensive cigarettes. Clearly, there are factors other than pricing and affordability that are influencing smokers in West Virginia.
If we take a step back from the United States and look to Australia, we can get a better sense for how well smoking rates hold up in the face of extreme pricing and cost relative to income. The average Australian smoker burns through 13 cigarettes per day compared to 14 per day in the U.S. A pack of 20 cigarettes in Australia costs $35 (more than four times the average price in the U.S.). It’s almost three times as expensive in terms of cost relative to income to be a smoker in Australia than it is in New York (smoking costs almost 12% of the median Australian household income compared to over 4.5% in New York). And yet, over 11% of Australians still smoke, which is higher than in California where cigarettes are a little over 25% the price and where smoking is over three times more affordable. While Australia has succeeded in using annual price hikes as high as 12.5% to drive its smoking rate down from 25% in 1991 to under 12% today, the effect of price increases on prevalence reduction has stalled over the last few years. Australians are quitting at much lower rates these days despite continued hikes on already all-time-high cigarette prices.
So what’s the bottomline?
(1) When looking at smoking rates on a state-by-state basis, price and cost relative to income alone are not hard-and-fast predictors of prevalence. Other factors play a role. Prevalence is likely dependent on the characteristics of distinct populations. Cost per pack and cost relative to income are just two factors, alongside many others like lifestyle, education, religion, and culture, that influence prevalence.
(2) The effect of price hikes on smoking rates has its limits — the law of diminishing returns seems to apply as each incremental increase in price produces a smaller and smaller effect on prevalence. If Australia is any indication, pricing runway in the U.S. could be indefinite. While higher prices generally correlate with lower rates of smoking, not even extremely high smoking costs have been able to drive prevalence to under 11% in Australia.
MO 0.00%↑ BTI 0.00%↑ PM 0.00%↑
This is a great post, very informative, and getting to the heart of the matter. Volume declines only tell one part of the story, and the less important one compared to price elasticity. Thanks for sharing.
Great analysis disproving "common sense" arguments when it comes to pricing vs volume.
Any analysis on how pricing affects cigarette brand loyalty?
Recent US data seems to show significant migration from premium brands of $MO and $BTI to affordable brands of $IMB.L and $VGR.